
简介
使用prometheus监控nginx的话目前有两个模块,一个是http_stub_status_module另外一个是nginx-module-vts,但是值得注意的是,这两个模块显示的都是http7层的,如果你使用nginx做的是4层tcp的代理,那么监控不了,我看了下网上貌似也没有很好的监控4层的方法
编译nginx
http_stub_status_module 模块默认是在nginx源码包里面的所以编译的时候不需要额外去下载,但是vts模块是需要额外下载的,并且在编译的时候要包含进去
git clone git://github.com/vozlt/nginx-module-vts.git
之后编译
./configure --prefix=/data/nginx/nginx --with-stream --with-http_ssl_module --with-http_stub_status_module --add-module=/data/nginx/download/nginx-module-vts
如果有
adding module in /data/nginx/download/nginx-module-vts
就说明没有什么问题了
make -j 4
接着就是替换正在运行的nginx模块
mv /data/nginx/nginx/sbin/nginx /data/nginx/nginx/sbin/nginx-20210202-bak-2 && cp objs/nginx /data/nginx/nginx/sbin/
看下正在运行的nginx
ps -ef |grep nginx
root       1964      1  0  2020 ?        00:00:00 nginx: master process sbin/nginx
nobody    50697   1964  0 1月27 ?       00:00:17 nginx: worker process
nobody    50698   1964  0 1月27 ?       00:00:20 nginx: worker process
nobody    50699   1964  0 1月27 ?       00:00:22 nginx: worker process
nobody    50700   1964  0 1月27 ?       00:00:33 nginx: worker process
root      57586  54505  0 13:05 pts/0    00:00:00 grep --color=auto nginx
之后要在nginx中加入下面的配置
http {

    vhost_traffic_status_zone;
    ...
    ...
    server {
        ...
        ...
        # http_stub_status_module 状态
        location = /basic_status {
            stub_status on;
            allow 192.168.0.0/16;
            deny all;
        }
        # nginx-module-vts 状态
        location /status {
            vhost_traffic_status_display;
            vhost_traffic_status_display_format html;
            allow 192.168.0.0/16;
            deny all;
        }
        ...
        ...
因为是nginx,所以监控的页面最好不要对外公开,我就加了deny all;
之后检查配置
sbin/nginx -t
重启nginx
sbin/nginx -s stop && sbin/nginx
看下新的nginx
ps -ef |grep nginx
root      60845      1  0 13:32 ?        00:00:00 nginx: master process sbin/nginx
nobody    60888  60845  0 13:36 ?        00:00:00 nginx: worker process
nobody    60889  60845  0 13:36 ?        00:00:00 nginx: worker process
nobody    60890  60845  0 13:36 ?        00:00:00 nginx: worker process
nobody    60891  60845  0 13:36 ?        00:00:00 nginx: worker process
root      60913  54505  0 13:54 pts/0    00:00:00 grep --color=auto nginx
之后访问nginx的ip/status和ip/basic_status
如果可以访问那么就没有什么问题了
配置prometheus
prometheus mertics的访问地址是
https://ip/status/format/prometheus
所以在prometheus中添加下面配置
  - job_name: 'nginx-out'
    metrics_path: '/status/format/prometheus'
    scheme: 'https'
    static_configs:
    - targets: ['ip']
      labels:
        instance: dev-nginx
之后重新加载prometheus的配置
curl -XPOST http://ip:9090/-/reload
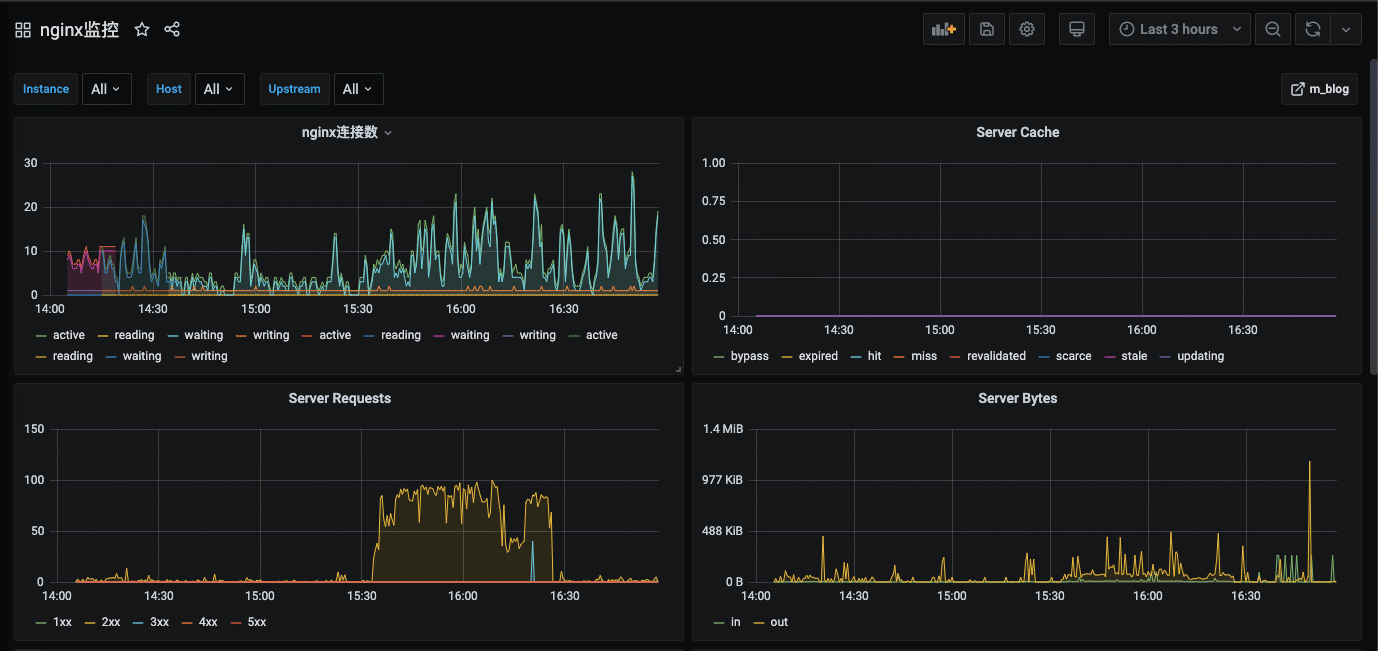
加载完成之后去grafana中添加面板,为了方便,我直接上传了一个面板,id是13816欢迎下载
欢迎关注我的博客www.bboy.app
Have Fun