简介
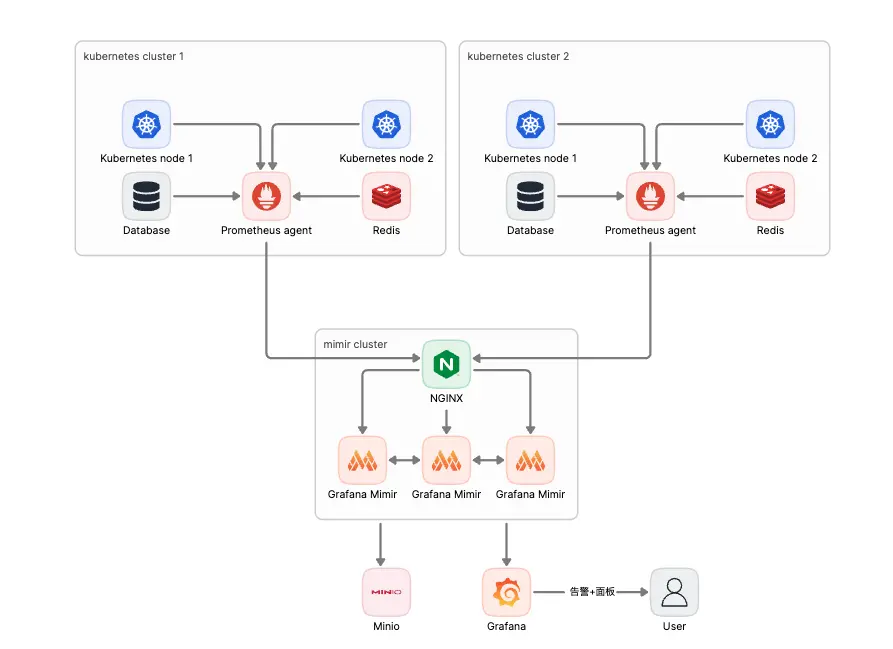
大家都知道,我之前的监控是使用 prometheus + thanos 做的,但是 thanos 组件过于多,很麻烦,组件之间各种链接,当你做多集群监控的时候因为组件过于多,维护会很难受,因此就想着用 grafana 的mimir去替换掉 thanos
mimir介绍
如果熟悉 thanos 的话,其实mimir是很好上手的,因为mimir很多的组件和 thanos 是重叠的,下面是 thanos 的组件
- Compactor
- Querier/Query
- Query Frontend
- Receiver
- Rule (Aka Ruler)
- Sidecar
- Store
- Tools
下面是mimir的组件
- Compactor
- Distributor
- Ingester
- Querier
- Query-frontend
- Store-gateway
- (Optional) Alertmanager
- (Optional) Overrides-exporter
- (Optional) Query-scheduler
- (Optional) Ruler
如果你研究 thanos 的话,你要清楚知道各个组件是干什么用的,但是你研究mimir刚开始的时候其实可以不用那么清楚的知道各个组件的用处,因为mimir提供了三种部署模式
- 单体模式
- 微服务模式
- 读写模式
单体模式很简单,就是直接启动所有的组件在一个进程中,适合量比较小的监控系统
微服务模式就是把各个组件都拆开单独部署,有点小复杂,适合大规模应用
如果你不想这么复杂,但是又有一定的量的话,可以试试读写模式,类似于数据库中的读写分离
因为我不想和之前 thanos 一样这么复杂,所以就选择了单体模式去部署到k8s中,毕竟刚开始就这么复杂也没有什么必要,我k8s的 yaml也是根据下面这个
https://github.com/grafana/mimir/tree/main/docs/sources/mimir/get-started/play-with-grafana-mimir
去修改的
部署说明
我所有的部署,都是在k8s下面进行的,所有的 yaml 使用kustomization去编译,然后扔到 git 上使用 argocd 去部署,这样我可以方便知道每一次修改了什么东西,下面是mimir目录结构
mimir
|____mimir
| |____mimir-1
| |____mimir-0
| |____grafana
| |____minio
| |____mimir-2
部署 minio
mimir支持的存储其实并没有和 thanos 一样那么多,但是我觉得支持那么多也没啥必要,只要支持s3就足够了,下面是mimir支持的存储
- Amazon S3 (and compatible implementations like MinIO)
- Google Cloud Storage
- Azure Blob Storage
- Swift (OpenStack Object Storage)
后期肯定是会支持更多的存储的
minio 这里我定义成了 statefulset,后端 pvc 用什么大家可以根据实际的情况去操作,也没有什么特别的,除了statefulset再去创建一个 service 可以让 mimir 去链接就好了
sts.yaml
apiVersion: apps/v1
kind: StatefulSet
metadata:
  name: minio
  namespace: mimir
spec:
  selector:
    matchLabels:
      app: minio
  serviceName: "minio"
  replicas: 1
  template:
    metadata:
      labels:
        app: minio
    spec:
      containers:
      - name: minio
        image: minio/minio:RELEASE.2023-08-23T10-07-06Z
        command:
          - sh
          - -c
          - mkdir -p /data/mimir && minio server /data --console-address :9001
        env:
        - name: MINIO_ROOT_USER
          value: mimir
        - name: MINIO_ROOT_PASSWORD
          value: xxxxxxxxxxxxxxxxx
        ports:
        - containerPort: 9000
          name: http
        - containerPort: 9001
          name: web
        volumeMounts:
        - name: minio-data
          mountPath: /data
  volumeClaimTemplates:
  - metadata:
      name: minio-data
    spec:
      accessModes: [ "ReadWriteOnce" ]
      storageClassName: "xxxxxxxxxxxxxxxxxxx"
      resources:
        requests:
          storage: 500Gi
svc.yaml
apiVersion: v1
kind: Service
metadata:
  name: minio
  namespace: mimir
spec:
  selector:
    app: minio
  type: ClusterIP
  ports:
  - name: minio
    protocol: TCP
    port: 9000
    targetPort: 9000
kustomization.yaml
resources:
- ./pvc.yaml
- ./deploy.yaml
- ./svc.yaml
部署mimir-0
mimir 这边我定义的是 deployment + pvc
deploy.yaml
apiVersion: apps/v1
kind: Deployment
metadata:
  name:  mimir-0
  namespace: mimir
  labels:
    name: mimir
    app: mimir-0
spec:
  selector:
    matchLabels:
      app: mimir-0
  replicas: 1
  template:
    metadata:
      labels:
        app:  mimir-0
        name: mimir
    spec:
      containers:
      - name: mimir
        image: grafana/mimir:2.9.0
        args:
          - -config.file=/etc/mimir.yaml
        ports:
        - containerPort: 8080
          name: http
        - containerPort: 7946
          name: memberlist
        volumeMounts:
        - name: mimir-conf
          mountPath: /etc/mimir.yaml
          subPath: mimir.yaml
        - name:  mimir-data
          mountPath: /tsdb
      volumes:
        - name: mimir-conf
          configMap:
            name: mimir-conf
            items:
            - key: mimir.yaml
              path: mimir.yaml
        - name:  mimir-data
          persistentVolumeClaim:
            claimName: mimir-0
      restartPolicy: Always
pvc.yaml
apiVersion: v1
kind: PersistentVolumeClaim
metadata:
  name: mimir-0
  namespace: mimir
  labels:
    app: mimir-0
spec:
  storageClassName: xxxxxxxxxxxxxx
  accessModes:
  - ReadWriteOnce
  resources:
    requests:
      storage: 50Gi
svc.yaml
apiVersion: v1
kind: Service
metadata:
  name: mimir-0
  namespace: mimir
spec:
  selector:
    app: mimir-0
  type: ClusterIP
  ports:
  - name: mimir
    protocol: TCP
    port: 7946
    targetPort: 7946
部署mimir-x
因为 mimir 可以横向无限扩容下去,所以你可以无限部署下去,除了名字不一样,其他的都一样,我的话部署了三个节点
- mimir-0
- mimir-1
- mimir-2
这三个节点的配置肯定是一样的,如下
mimir.yaml
target: all

common:
  storage:
    backend: s3
    s3:
      endpoint: minio:9000
      access_key_id: mimir
      secret_access_key: xxxxxxxxxxxxxxx
      insecure: true
      bucket_name: mimir

blocks_storage:
  s3:
    bucket_name: mimir-blocks

memberlist:
  join_members: [mimir-1.mimir.svc.cluster.local, mimir-1.mimir.svc.cluster.local, mimir-1.mimir.svc.cluster.local]

server:
  log_level: info


limits:
# 一个租户允许摄取的大小
  ingestion_rate: 100000
  ingestion_burst_size: 2000000
配置貌似也没有什么可以说的
之后定义 mimir 集群的 svc 来和 ingress 绑定
apiVersion: v1
kind: Service
metadata:
  name: mimir
  namespace: mimir
spec:
  selector:
    name: mimir
  type: ClusterIP
  ports:
  - name: mimir
    protocol: TCP
    port: 8080
    targetPort: 8080
因为是多集群的监控,所以集群和集群之间肯定不是处于一个网络下,所以为了安全,mimir 和 prometheus 之间的链接最好有一个认证,简单起见,直接使用 http basic auth 了
所以创建一个 secret 定义 http basic auth 的账号密码
auth.yaml
apiVersion: v1
data:
  auth: xxxxxxxxxxxxxxxxxxx
kind: Secret
metadata:
  name: basic-auth
  namespace: mimir
然后就是 ingress
ingress.yaml
apiVersion: v1
kind: Secret
metadata:
  name: mimir
  namespace: mimir
type: kubernetes.io/tls
data:
  tls.crt: xxxxxxxxxxxxxxxxxx
  tls.key: xxxxxxxxxxxxxxxxxx

---
apiVersion: networking.k8s.io/v1
kind: Ingress
metadata:
  name: mimir
  namespace: mimir
  annotations:
    kubernetes.io/ingress.class: "nginx"
    nginx.org/proxy-connect-timeout: "180s"
    nginx.org/proxy-read-timeout: "180s"
    nginx.org/client-max-body-size: "1024m"
    nginx.ingress.kubernetes.io/auth-type: basic
    nginx.ingress.kubernetes.io/auth-secret: basic-auth
    nginx.ingress.kubernetes.io/auth-realm: 'Authentication Required'
spec:
  tls:
  - hosts:
      - mimir.xxxxxxxxxxxx.com
    secretName: mimir
  rules:
  - host: mimir.xxxxxxxxxxxx.com
    http:
      paths:
      - path: /
        pathType: Prefix
        backend:
          service:
            name: mimir
            port:
              number: 8080
然后就是总的
kustomization.yaml
resources:
- ./mimir-0
- ./mimir-1
- ./mimir-2
- ./minio

- ./ingress.yaml
- ./svc.yaml
- ./auth.yaml

namespace: mimir

configMapGenerator:
- name: mimir-conf
  files:
  - ./mimir.yaml
  options:
    disableNameSuffixHash: true
定义 grafana
grafana 这部分就不说了,没什么好说的
定义 prometheus
prometheus 一定要是 agent 模式,不然的话部分数据是直接存储在 prometheus 中的,你在 grafana 中添加 mimir 的数据源之后,默认就少了两小时的数据
同样 prometheus 我也定义成 deployment
deploy.yaml
apiVersion: apps/v1
kind: Deployment
metadata:
  name:  prometheus
  namespace: prometheus
  labels:
    app:  prometheus
spec:
  selector:
    matchLabels:
      app: prometheus
  replicas: 1
  template:
    metadata:
      labels:
        app:  prometheus
    spec:
      securityContext:
        runAsUser: 0
      hostAliases:
        - ip: 1.1.1.1
          hostnames:
            - mimir.xxxxxxxxx.com
      serviceAccountName: prometheus
      containers:
      - name:  prometheus
        image:  prom/prometheus:v2.46.0
        ports:
          - containerPort: 9090
            name: web
        args:
        - --enable-feature=agent
        - --config.file=/etc/prometheus.yaml
        volumeMounts:
        - name: prometheus-config
          mountPath: /etc/prometheus.yaml
          subPath: prometheus.yaml
        - name: prometheus-data
          mountPath: /prometheus
      volumes:
      - name: prometheus-config
        configMap:
          name: prometheus-config
      - name:  prometheus-data
        persistentVolumeClaim:
          claimName: prometheus
      restartPolicy: Always
这里我用了hostAliases,这样子的话可以不用添加 dns 解析了,而且进一步加强了安全
注意
--enable-feature=agent
开启 agent 模式
pvc.yaml
apiVersion: v1
kind: PersistentVolumeClaim
metadata:
  name: prometheus
  namespace: prometheus
  labels:
    app: prometheus
spec:
  storageClassName: xxxxxxxxxxxx
  accessModes:
  - ReadWriteOnce
  resources:
    requests:
      storage: 50Gi
然后就是 prometheus 的配置
prometheus.yaml
global:
  scrape_interval: 5s
  external_labels:
    cluster: xxxxxxxxxxxxx

  - job_name: node-exporter
    static_configs:
    - targets:
      - "192.168.1.1:9100"

remote_write:
  - url: https://xxxxx:[email protected]/api/v1/push
    headers:
      X-Scope-OrgID: xxxxxx
kustomization.yaml
resources:
- ./deploy.yaml
- ./pvc.yaml

namespace: prometheus
configMapGenerator:
- name: prometheus-config
  files:
  - ./prometheus.yaml
  options:
    disableNameSuffixHash: true
之后的工作
之后就是添加各种各样的 exporter 去采集数据就好了,当然你也可以把 prometheus 去换成 grafana agent,但是 grafana agent能采集的东西也就那么多,并不是很全面,虽然对于大部分场景是够用了的,所以我这边还是使用 prometheus 比较优雅
欢迎关注我的博客www.bboy.app
Have Fun