Introduction
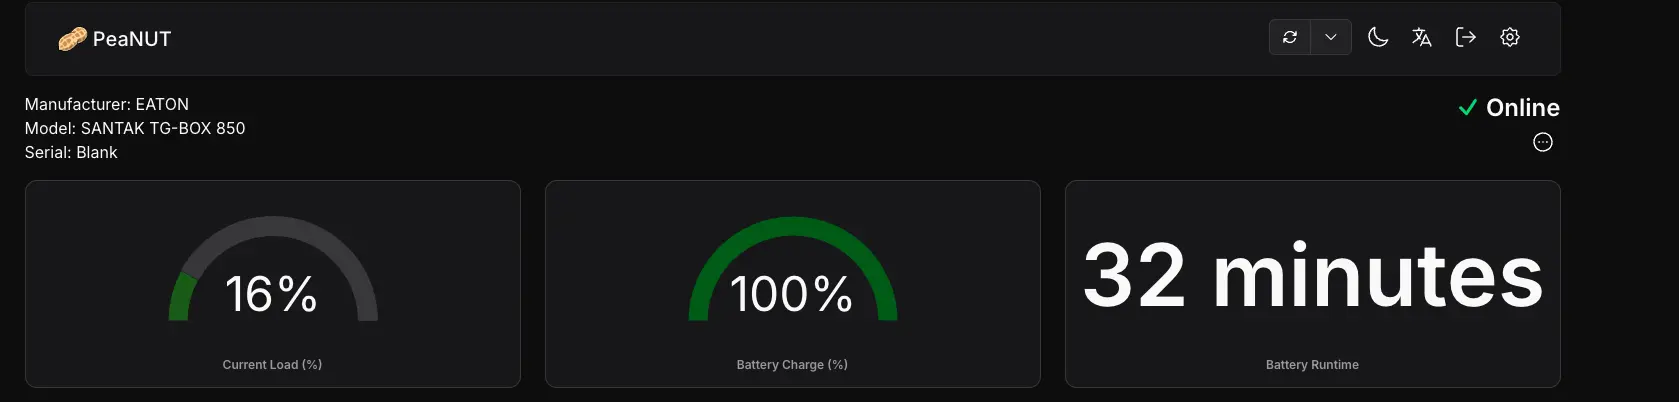
My SANTAK TG-BOX 850 UPS has been sitting quietly in the corner without much attention. Today I considered integrating it into Grafana to monitor its status, which led me to discover the Peanut project. Peanut is a micro dashboard for Network UPS Tools (NUT) that provides a visual overview of UPS status and supports Prometheus integration.
https://github.com/Brandawg93/PeaNUT
Deploying Peanut
Recommended one-step deployment using Docker Compose:
version: "3"
services:
  peanut:
    image: brandawg93/peanut:5.7.5
    container_name: peanut
    restart: "always"
    volumes:
      - "/etc/localtime:/etc/localtime"
      - "./config:/config"
    ports:
      - 8080:8080
    environment:
      - WEB_PORT=8080
Configuring NUT Service on Synology NAS
Complete these steps through the DSM Control Panel:
- Open “Hardware & Power” settings
- Locate the “UPS” section
- Enable “Network UPS Server” functionality
- Add your Peanut server’s IP address under “Allowed Synology NAS devices”
- Click “Apply” to save settings
Peanut Configuration Guide
Access Peanut’s web interface and navigate to “Manage Servers” for initial setup:
- IP: Internal IP of your NAS
- Port: 3493 (default NUT port)
- Username: monuser (default)
- Password: secret (default)
- Save settings
After saving, refresh the main page several times - data might not appear on the first few attempts.
Prometheus Configuration
PeaNUT provides native Prometheus-formatted metrics:
  - job_name: "peanut"
    metrics_path: /api/v1/metrics
    static_configs:
      - targets: ["ip:8080"]
Grafana Visualization
Recommended official dashboard template:
https://github.com/Brandawg93/PeaNUT/blob/main/examples/prometheus/grafana/provisioning/dashboards/PeaNUT.json
Feel free to follow my blog at www.bboy.app
Have Fun